This is a research paper that was presented at the Global Investigative Journalism Conference 2017 Academic Track, which IJEC organized and covered. For more research and coverage of GIJC17, see here.
News bot for the newsroom: how building data quality indicators can support journalistic projects relying on real-time open data
By Laurence Dierickx, Université Libre de Bruxelles
Abstract
Storytelling with data has become a trend in journalism with the rise and growth of data-driven journalism practices encompassed in the field of computational journalism. It aims to provide quality information, which may not be made possible without high quality data. According to the ISO 9000, definition of quality is regarded as the ability to satisfy stated or implicit needs.
This paper proposes a conceptual framework to assess data quality with a combination of deterministic and empirical quality indicators. If data quality is a multidimensional concept, the object is here to establish how to fit the needs of journalistic projects. Formal quality indicators are essentials when data are collected and/or automated. We can call it the technical challenge. Empirical indicators are also essentials regarding professional practices. We can call it the journalistic challenge. This part of the paper also demonstrates how and why data quality literacy is able to meet and to support journalistic requirements.
This framework was applied in the context of a case study. “Bxl’air bot” is an automated web application (news bot) fed with real-time open data about air quality in Brussels. Air quality can be here considered as a social problem, which concerns environment, mobility, economic and health politics. The news bot aims to objectivate a situation regarding the European’s norms as well as the World Health Organizations’ recommendations. The news bot is here considered as an object of journalism and as a tool for the Belgian newsroom Alter Echos involved in this research project.
If the framework has helped to make appropriate conceptual decisions, from a constructivist approach, the necessity to well understand the data lifecycle was also highlighted to complete the framework.
Keywords: computational journalism, data journalism, open data, data quality
Introduction
Data are playing an important role in the journalistic context, with having become the raw material for trending projects encompassed under the name of “computational journalism”. According to Flew & al. (2012), computational journalism draws from the fields of computer science, social sciences, and media and communications theories. It is described by Hamilton & Turner (2009) as a combination of algorithms, data, and knowledge from the social sciences to supplement the accountability function of journalism. From a process perspective, it can also be seen as an application of computing and computational thinking to the activities of journalism which include gathering, organization, sense making and dissemination (Diakopulos 2011). Diakopoulos points out that it upholds core values of journalism, such as accuracy and verifiability. For Coddington (2014), computational journalism differs from data journalism inter alia because it offers less transparency in its process, even if it also deals with large amount of data.
Data storytelling relying on practices and tools of computational journalism can adopt heterogeneous forms which include news applications, statistical analysis and automated contents generation like maps, infographics or texts in natural language. Fed by structured data, they are challenging both the technical and the journalistic sides. Moreover, the pursued goal is not different than any other form of journalism, which is to provide quality information.
What does quality mean in journalism? According to Clerwall (2014), this is a multifaceted concept “that can refer to an overall, but something vague, notion of ‘this was a good article’” and that can also depend on the sociocultural background of the receiver. The concept of quality in journalism covers a wide range of other empirical concepts, broadly discussed among researchers, like objectivity, accuracy, believability, reliability or trustworthiness. If it could also be resumed as the degree or level of overall excellence in a news story (Sundar 1998), the concept remains difficult to define likewise in the field of data science when it is talked about quality information. In this field, it is considered that quality information may not be possible without high quality data (Batini & al, 2009).
The concept of data quality could be related to formal characteristics as well to its intrinsic, representational and contextual dimensions, while the ISO 9000, related to the management of quality, proposes a user-centric approach. Quality is so regarded as the ability to satisfy stated or implicit needs (Boydens & van Hooland, 2011). These needs will depend on their contexts of use, making the issue of quality even more complex to tackle.
In addition, it is important to identify the data lifecycle correctly in order to understand how data are produced, validated and disseminated. Data lifecycle is a concept derived from data management. Its purpose is to study the processes of acquisition, curation and data preservation. Its modeling aims at optimizing the data flow management within an information system, from the creation of data to their archiving and destruction (Reid & al 2007). On the epistemological level, a positivist approach assumes that data reflect the reality observed. A constructivist approach argues that data are built over time: as results of empirical observations, data are likely to change over time (Boydens 1999).
Those considerations could be applied as well to computational journalism. An accurate and reliable information can only rely on accurate and reliable data. Data quality issues are not trivial, especially when data are used as raw material for news contents. As Essa underlined (quoted by Flew & al. 2010), both journalism and information technology are concerned with information quality and reliability.
Graefe (2016) has defined the double condition to succeed with automation of news information: data must be structured and with a good quality enough to achieve goals of accuracy and actuality. “The Quartz guide to bad data” (2016) underlines that journalists are increasingly confronted with data, which can be “full of problems.” Knowing those problems makes it possible to provide solutions. Otherwise, data cannot be used.
Those observations have conducted to the building of a conceptual framework that aims to identify possible issues before using data within an automated data-driven journalism project. This framework was applied to support the design of an automated news application (news bot), which relies on real-time open data about air quality in Brussels to support a broader investigative project led by the French-speaking newsroom Alter Echos.
Theoretical backdrop
The conditions of use of data-driven journalistic projects have been little discussed in the journalistic field. However, they focus on the accuracy and reliability of the data, while emphasizing the need to develop these projects in accordance with the ethical principles governing journalistic practices. Ethics in journalism have been defined and upheld for decades, notes Howard (2013), but the context in which they are practiced “has shifted with changes in technology and society”.
Bradshaw (in Zion & al. 2014) argues that it is useful to ask whether data are accurate and verifiable. He advocates that journalists have to question themselves about the precision of data, the way in which data are collected as well as the way to put them in context. He also highlights the value of working with the most relevant data rather than working with the most accessible data. In a post published on his own blog (Bradshaw 2013), he says that the most basic ethical consideration relies on the need to be accurate and to provide proper context to the storytelling.
Kent (2014), editor at the US news agency Associated Press which has been using natural language generation technologies since 2014, has established an ethical “checklist” where he proposes to think about – inter alia – how accurate the underlying data is, if the subject is appropriate for automation and in this case, how automation is organized.
Dörr & Hollnbuchner (2016) have pointed that if structured data is a precondition for automation and its journalistic use, the origin of data must be identified. But data must also be reliable and accurate: a software could do erroneous reporting due to a poor coding or poor data sources. What happens when missing data are send to the information system or when items are in disorder, limiting so the value of the data-set? Missing items can lead to biases during content generation, researchers say. Because it is entirely driven by structured data available, an automated news production system is limited. In addition, if data are available, they are not free of anomalies. Data can be mixed with other data in a single field, or arbitrarily presented in multiple fields (Casswell & Dörr 2017).
Data quality literacy
Data quality was mainly studied in the context of private and public institutions where large databases must be managed. It consists in a multidimensional principle, which concerns both the contents, the process and the design of the database. It involves different kinds of aspects such as management, design, data analysis, quality control, storage and presentation (Pipino & al 2002, Chapman 2005). The relevance of this principle lies both in the decision-making and operational processes (Wand &Wang 1996).
Researchers agree that data quality can only be defined by the uses, which are always linked to a particular application domain. They have also underlined that data quality cannot be reduced to the only formal prism of the triple “entity-attribute-value” (Redman 1996, Eckerson 2000) which leads, for example, to detect formal anomalies in databases. Furthermore, data collected from empirical observations are subject to change over time. This is why there is no absolute reference to test the correction of empirical databases. Like instant pictures, values enclosed in empirical databases reflect the real world only at a given moment (Boydens 2012). This posture refers to the principle of actuality underlying the dissemination of journalistic information.
Researchers also emphasized the importance of having quality metadata (Scannapieco & al 2004, Weidema & Wesnaes 1996). The function of metadata is to document a data-set and thus promote the re-use of data. Shanks (1999) points out that metadata are important to help users to easily assess and understand data.
Data quality is even more problematic when data are posted on the web (Batini & al 2009): are they up-to-date, is there a management of records and versions?
Data quality can be regarded as a set of multidimensional characteristics, which were broadly discussed among researchers. Brodie (1980) has emphasized three components: reliability, semantic integrity and physical integrity. Strong & al. (1997) have identified four main characteristics translated in a set of data quality attributes: intrinsic (objectivity, accuracy, believability, reputation), contextual (value added, relevancy, timeliness, completeness, appropriate amount of data), representational (interpretability, ease of understanding, representational consistency, concise representation), and accessibility (accessibility, access security).
All of those attributes are summarized by Redman (2001): data must be accessible, accurate, timely, complete, consistent with other sources, relevant, comprehensive, with a proper level of details to be read and understood. Haug & al. (2009) retain, in the context of Enterprise Resource Planning (ERP), three data quality dimensions: intrinsic data quality dimension (completeness, unambiguousness, meaningfulness, and correctness), data accessibility dimension (access rights, data storage, representation barriers), and data usefulness dimensions (relevance, value-adding).
An approach based on semiotic levels was proposed by Shanks (1999). This concerns the use of symbols to convey knowledge: syntactic (formal representation, about data structure), semantic (completeness and accuracy, about the meaning of data), pragmatic (usability and suitability to the task, about the uses of data) and social (understandability, about the sharing of knowledge generated by the use of data).
Tejay & al. (2005) have suggested to add an empirical layer to this semiotic framework, which includes the dimensions of accessibility and temporality. The syntactic level should take into account criteria such as accuracy, consistency and integrity. The semantic level should also refer to dimensions of non-redundancy, credibility, reliability and non-ambiguity. The pragmatic level should consider dimensions of relevance and completeness.
These different approaches demonstrate that data quality cannot be evaluated solely from a deterministic perspective. Empirical considerations must also be taken into account, regarding the application domain related to data.
Bad data quality: causes and effects
Reasons of bad data quality are numerous: from the design of the information system (Moody & Shanks 2003) to the respect of the integrity constraints of a relational database (Fox & al., 1994), via the semantics of data, whose heterogeneity can lead to problems of interpretation (Madnick & Zhu 2006). Boydens (1999) also points out that large amounts of anomalies could mean that the database is no longer relevant. For the researcher, the question is not so much to define what are correct data but rather it would involve questioning how data are built over time. This position refers to the data lifecycle concept.
Chiang & Miller (2008) found that quality problems often occur due to changes in uses, to changes in the perception of data, or to violations of the database integrity constraints (which functions are to preserve data consistency and accuracy).
Networked databases are also a potential source of data quality issues (Batini & al 2009): information systems could be heterogeneous, encoding practices may differ from a database to another, the same data could be recorded in several databases.
If those aspects are more linked to the technical field, the understanding of the conditions in which data are produced might highlight issues related to the data producer. That involves to investigate this point from a journalistic point of view, especially if data are sensitive: a story could be hidden behind.
In the field of news information, bad data quality can have serious consequences. This is particularly the case in the field of economic or business news, where information could likely have an impact on markets, which are particularly sensitive (McCallum 2014). However, bad data are not the only reason why an automation project could fail. It can also be due to exogenous factors such as the design of the process or even as wrong interpretation by the information system, which are related to human errors (Zion & Craig 2014).
Lecompte (2015) cites the case of an automated news about Netflix’s second-quarter earnings, which stated that the company had not met expectations. The error – a human one – came from values that could have been split in two: “7” and “1” became “71”. Another example of abnormal data value has occurred more recently, when the automated writing system Quakebot has reported, for the L.A. Times, an earthquake that happened in 1925, creating panic movements on social networks. The error came from a human update in the database of the American Geological Institute (UGS), reported the L.A. Times. When a story relies on bad data, the story will be bad too: garbage in, garbage out. But the main lesson learned from those cases is the need for some editorial control on automated news contents: in any cases, the human factor remains important.
According to Linden (2017), integrity, quality and reliability of available data are essential to automated news as well as to other forms of journalism. Therefore, the choice and assessment of data should be a journalistic process while validation, standardization, normalization of data should be a playing field for programmers. However, it appears that this borderline is not so clearly defined. The development of computational journalism practices has not only led to new collaborations between journalists and computer scientists (Lewis & Usher 2014, Karlsen & Stavelin 2014). It has also led to the emergence of new professional profiles, where journalistic skills meet technological ones (Royal 2010, Paraise & Dagiral 2012). This illustrates the fact that databases are more and more escaping the interest of computer scientists. This evolution would be linked to both technical and social transformations (Flichy & Parasie 2013).
Building quality indicators for automated data-driven stories
Beyond data and their processing, the journalistic value of an automated project lies in the sense given to it. This variable was important to take into account within the design of a framework aiming to evaluate the relevance of a data-set in the perspective to be automatized in a data-driven project. The framework first proposes to assess the strengths and weaknesses of a data-set with the help of data quality indicators which meet technical and journalistic challenges. Those were first experimented in a previous research which aimed to assess the overall quality of the open data portal of the French city of Rennes regarding four different types of uses, journalistic included (Tredan & Dierickx 2017). In this research, assessments were made with the use of Open Refine, an open source software that can be used for data profiling (Verborgh & De Wilde 2013). A third kind assessment, more global, is based on five axes covering both technical and journalistic challenges, and was designed for the context of automated news production.
Formal data quality indicators: the technical challenge
Quality indicators associated with formal data quality as well as the dimensions of data quality are facing the technical challenge for an optimal reuse of data free of error or of bias. The objective is to get data that fit development requirements for the use in the context of generated news contents (web applications, data visualizations, natural language generation…).
Four axes are here proposed to assess the formal data quality of a data-set: (1) the documentary axis, related to the understandability of data-sets, (2) the encoding axis, related to the technical encoding aspect of the data, (3) the normative axis, considering that the respect of norms fosters the interoperability and so the reuse of data, (4) the semiotic axis, related to the syntactic and semantic coherence of data.
Table 1
Formal data quality indicators
Documentary Unique identifierAvailable metadataConformity metadata/data-setTerms of use
Axis |
Assessment Types |
Encoding |
No encoding problemNo HTML overloadNo duplicate data |
Normative |
Use of standards (e.g. e-mail, date, address, geolocation,…) |
Semiotic |
No missing valueNo orthographical incoherenceExplicit labelling |
Those deterministic indicators aim to assess data quality in a formal way. That means that the assessment could be made on a Boolean mode, with simply responding “true” or “false”.
Note that the total amount of formal indicators used for an assessment could vary from one data-set to another, as each application domain has its own particularities. In addition, formal anomalies in a data-set could be subject to interpretations. For example, the NULL value can be interpreted in several ways: the information exists but is not known, the information is not relevant for the entity, information is relevant but does not exist for the entity, the attribute value is equal to zero (Hainaut 2012). Besides, poor quality data can coexist with correct data without generating errors (Wang & Strong 1996). Sources may contain an error such that the data does not have the meaning expected by the user.
Data quality dimensions and empirical indicators: the journalistic challenge
Journalism literacy has permitted to frame the requirements of an automated data-driven project. Quality indicators associated with them are based on the dimensions of data quality and on the journalistic requirements. They are facing the journalistic challenge. The focus is here placed on two particular dimensions: the intrinsic one and the contextual one, which meet journalistic preoccupations about accuracy, correctness, precision and completeness.
Table 2
Data quality dimensions indicators
Dimension |
Assessment types |
Contextual |
Primary Source (authentic)Appropriate amount of dataCompleteness (no missing values)Relevance |
Intrinsic |
Accuracy (syntactic correctness)Precision (no anomalies observed in values)Correctness (f.e, last update mentioned) |
Those quality indicators aim to complete the formal aspect of data quality assessment. Insofar, they can also be assessed on a Boolean mode (true or false). The “completeness” indicator might be more difficult to assess due to the issue of the NULL value. The indicator related to the appropriate amount of data might as well be difficult to assess, mostly if the data-set counts hundreds of records.
It is also important to note that a primary source, which refers to the responsible for the control and of the monitoring over time of the quality of the information produced, does not guarantee the quality of a data -set but only give indications about it (Boydens 2014).
Global assessment model
The quality of a data-set cannot only be assessed with deterministic indicators. If empirical indicators are subjective they cannot be avoided in journalistic context. It is up to journalists, or those involved in a data-driven project to remain critical to a data-set, including when it comes from public authorities or when it is reported from an authentic source. Furthermore, data may contain truths but also bias (Howard 2014). This critical level cannot, either, be objectified without a bit of investigation.
A global assessment model for the use of data in the context of news production proposes to join both the technical and the journalistic challenges with putting the two previous models under the lights of the principle of reliability, which concerns both fields of journalism and computerized databases. This global model intends to evaluate (1) the reliability of the data source, (2) the modalities to access data, (3) the keys to understanding data and their production context, (4) if data characteristics allow automation, (5) if data are relevant for journalistic use.
Table 3
Global evaluation model for the use of data in the context of automated news production
Axis |
Questions to answer |
Source |
Is the data provider the producer and/or the authentic source? In the case of the data provider is not the original producer and/or the authentic source, what is the nature of its relationship with the original producer of the data and/or the authentic source? Are the data provider, the data producer and the authentic source of data trustworthy? |
Access |
Are data freely accessible? Are they licensed for free reuse? Are they available in a structured format? |
Documentation |
Are data documented by metadata or any other type of information which permit to understand the structure of the database and/or to remove any ambiguities in the data labeling? Is any expertise provided to understand what data values are? Are contextual elements provided? |
Automation |
Are data provided in a free and usable format? Do the data values meet the standards? Are the data values accurate? Is the data-set complete and up-to-date? |
Journalistic relevance |
Do data have an added value in journalistic terms? How does the data processing make sense? |
Case study: a news bot for a newsroom
This conceptual framework was applied in the context of a broader research about the uses of an automated news systems developed by the researcher to fit the needs of a Belgian newsroom Alter Echos, for the purpose of a wider investigative about air quality in Brussels. This research studies the relationship between journalists and automation technologies of news content production. It aims to establish the conditions of an association between journalists and automation technologies, as well as a use frame, based on the hypothesis of a fruitful collaboration.
If the news application, or news bot, results from a co-construction with two members in particular of the newsroom, their involvement has started from its first prototyping. Called “Bxl’air bot”, it provides real-time information about air quality in Brussels’ area. Generated contents are from various types: natural language generation, infographics and interactive map. It also provides a daily bulletin about air quality published on Alter Echos’ website. An RSS feed automatically publish news on Twitter as well as it send an e-mail alerts when an observed value exceeds a limit value defined by the World Health Organization (WHO).
Object of journalism with its own materiality (Anderson & De Maeyer 2014), the news application is also developed as a tool for journalists. Various data on air pollutant measurements are recorded daily, so that the history can be traced. On the platform, journalists can view the monthly reports for each air pollutants measured, as well as different types of statistics (cumulative totals per measured station, average and maximum). Five pollutants are monitored: small particles PM10, PM 2.5 and black carbon, ozone and nitrogen dioxide.
This experiment, which began in April 2017, intends to provide raw material for a wider investigative work, led by the editorial staff, to put data in context and to make sense of it. If we recognize to machines many virtues, they are not without limits. Automation technologies are suitable for performing repetitive tasks quickly, but they cannot be a substitute to the human being by providing the contextual dimension or in-depth analysis to enrich the narrative.
Due to the severe consequences linked to air pollutant emissions affecting public health, the WHO have published recommendations, which consist of average rates not to be exceeded either by twenty-four hours either by year. Those limit values are different from one atmospheric pollutant to another. Despite its potential effects more harmful to health than other types of small particles, there is nothing about black carbon. Those recommendations are somewhat more severe than the limit values fixed by the Directive 2008/50/EC of the European Parliament and of the Council of 21 May 2008 on ambient air quality and cleaner air for Europe. Limit values are here the result of compromises between EU Member States, the EU policy also taking into account the divergent economic interests of the car lobby.
European norms are binding. On 28 April 2016, Belgium was given a formal notice reminding its obligations, in particular as regards compliance with the limit value of the nitrogen dioxide in Brussels’ area, which has been exceeded during three consecutive years, from 2010 to 2012. In addition, the Commission considers that Brussels does not collect nitrogen dioxide concentrations in areas presenting the highest concentrations.
In sociology, the case of air quality in the European capital can be seen as a social problem, which consists in the transformation of any social fact into a public problem. The fact becomes a problem when it meets a process defining the experience as an offence and as a situation generating litigation (Neveu 1999). As it was defined by Becker, air quality in Brussels is a social problem because European norms are violated. Authorities are viewed a social agent with the power to produce legal norms and moral judgement. The delinquent act consists in exceeding the limit values. According to Neveu (2015), data contributes to the justification of a social problem, with playing a role of objectivation. The social problem of air quality in Brussels can also be viewed regarding the trilogy “naming-blaming- claiming” (Felstiner & al, 1980): measurements of air pollutants are generating disputes among citizen and environmental organizations which denounce the poor quality of the Brussels’ air while the European Commission requires Belgium to respect the European standards (“naming”); Belgian and Brussels authorities are considered as responsible of the situation and are blamed for not taking appropriate measures regarding the potential effects of pollutants in terms of public health (“blaming”) ; authorities are asked to remedy the situation with adopting appropriate policies (“claiming”). Belgian journalists are participating in this process as they publicized controversies.
The Directive 2008/50/EC establishes “reciprocal exchange of information and data from networks and individual stations measuring ambient air pollution within the Member States”. In Brussels’ area, the station’s network is managed by the regional authority within the public organism Brussels Environment. Data collected are then transmitted to the federal authority within the Belgian Interregional Environment Agency (IRCEL-CELINE), which communicates on the ambient air quality in the three regions of the country.
There are thus two possible public data sources, which provide real-time data on their respective website. The publishing mode differs from one actor to another: the regional institution will put the accent on the communication aspects while the federal institution will put the accent on the scientific aspects.
Application of the framework
Once identified, data sources have been submitted to the conceptual assessment framework. It has quickly appeared that data published by Brussels Environment were not complete enough to reach the aims of the news bot. Therefore, the global evaluation model was only applied to data available on the IRCEL-CELINE’s website, identified as the most complete and as the most relevant. It has permitted to make the most relevant choices within the design of the news application.
Source: The data publisher is not the original producer or the authentic source. However, its specific status makes it possible to assimilate it. The source is considered as reliable.
Access: Data related to fixed averages are only published by IRCEL-CELINE. If it exists, there is no publicity about an application programming interface (API) which provides real-time open data (slippery averages of the observed air pollutants) while the website provides both slippery and fixed averages. That means that only the website will be chosen for the data retrieval which supposes parsing techniques. Data are published in open data, under the Creative Commons Attribution 4.0 license that covers free sharing and free adapting with the obligation to cite the source. They are presented into HTML tables, in a structured format which can be modified during the experiment. That supposes a regular monitoring to correct any abnormalities linked to changes in the pages’ structure, including changes in the tables’ structure. This can be detected with a human monitoring of the web pages as well as with a human or automated monitoring of the database.
Documentation: Data are not documented with metadata files, but are widely explained and commented on many pages of the website, in a disparate and abundant way. Data are presented in separated pages depending on the air pollutant type. European norms are also explained. The structure of the tables, in which data are presented, is clearly understandable without any ambiguity. Data are available not only for the Brussels’ area but also for the two other regions, measurement station by measurement station. Dates are well mentioned. Those observations will help to create the structure of the database and to make appropriate decisions to get appropriate averages.
It was also observed that on the contrary to the others air pollutants, there were no averages concerning nitrogen dioxide for the Brussels’ area. That means that a computational function should be developed to get this particular average. The case of one measurement station is also mentioned. If it provides data about nitrogen dioxides, those data are not estimated as representative of the air pollution in Brussels. When looking at the values, it appears that this station presents one of the highest concentrations. To serve a journalistic purpose, data of this measurement station should be included in the news application.
Automation: Due to the HTML format of the page, data retrieval will require a parser to get real-time data as well as to get and store fixed averages data. As the news application is developed in PHP and MySQL, there are no obstacles for processing recorded data. Issues are more linked to the values of data itself. Some cells present missing or unknown values, marked “NA”. Automation process should include this dimension, with defining how to treat empty or NULL values without affecting the information system. Where necessary, the indication “Data not available” could be mentioned. Process should also take into account the fact that web pages and tables could evolve with time and should prevent from publishing empty fields or anomalies in order to remain accurate.
Journalistic relevance: The observation of data allows to quantify exceeding of European norms and WHO’s recommendations. This quantification permits to establish the difference between accepted and unacceptable values and to monitor the progress of measurements per station. Data allow a better representation of a state of facts at a given moment. Monitoring the evolution of air pollutant data over time is a relevant entry point for dealing with a controversial situation. If each pollutant is produced in a different way, the impact of the cars in the emission rates can be objectivated. Others entry points are also possible such as mobility and environmental policies or as impacts in terms of public health and economics. Therefore, data support a potentially rich subject on the journalistic level, the controversies to which they are subjected, mainly among citizen or environment associations, add to the journalistic interest. Moreover, automation permits to store data and is designed to provide relevant analysis to journalists.
The global assessment model has permitted to highlight strengths and weaknesses of the data-sets, regarding the journalistic purpose. It has also permitted to make the most relevant choices within the design of the news application. Despite lots of documents were provided on IRCEL-CELINE’s website, there were no indications about how are data collected, validated and then published.
The understanding of the data lifecycle related to air quality in Brussels has permitted to lift the last issues identified as problematic, such as the most appropriated tables to use to retrieve real-time data and as the relevant time to retrieve fixed averages. Being accurate means retrieving right data at the right time: as this process is also automated, the best instructions must be provided to the information system.
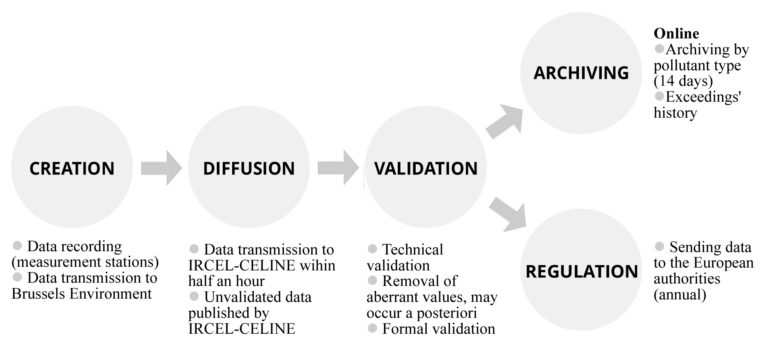
Figure 1. Data lifecycle of measured air pollutants in Brussels’ area published by IRCEL-CELINE
An interview with the representatives of the public institution IRCEL-CELINE has provided the expertise needed to fix once and for all pending issues, especially regarding the automated CRON procedure launched from a third-party online service for the retrieval and for the recording in the database. However, human monitoring is still required to ensure that the system does not encounter problems. These maintenance operations, even if they need very little time, are essential to guarantee the reliability of the news application.
Conclusion
This conceptual framework has linked two domains (data quality and journalism) in order to be used to assess the quality of a data set before its use in the context of automated news production. It can help to make the most appropriate decisions for the designing of an automation system as well as to prevent errors in relationship with the data retrieval.
Ambiguities can be lifted, partially or totally, with the understanding of the data lifecycle. As metadata are not always provided as well as other kinds of contextual information, an expert of the application domain can also be required. This was underlined in the case study, due to the scientific complexity of the domain of air pollution which thus has necessitated a bit of investigation. Limitations of this framework are mostly linked to subjective human interpretations.
With taking into account both technical and journalistic aspects, this conceptual framework has shown that data quality and journalism are sharing common concerns in order to produce quality information, despite the fact that this concept, likewise the data quality concept, remains complex to define. Data quality issues may be encountered in any data-set from any organization, public or private. At best they are known, at best they can be treated to serve the purpose of their finale use.
References
Anderson, C. W., & De Maeyer, J. (2015). Objects of journalism and the news. Journalism, 16(1), 3-9.
Batini, C., Cappiello, C., Francalanci, C., & Maurino, A. (2009). Methodologies for data quality assessment and improvement. ACM computing surveys (CSUR), 41(3), 16.
Boydens, I. (1999). Informatique, normes et temps. Bruylant.
Boydens, I., & van Hooland, S. (2011). Hermeneutics applied to the quality of empirical databases. Journal of documentation, 67(2), 279-289.
Boydens, I. (2012). L’océan des données et le canal des normes. In Annales des Mines- Responsabilité et environnement (No. 3, pp. 22-29). ESKA.
Boydens, I. (2014). Open data et eGovernment. Research Note (Smals), 33.
Bradshaw, P. (2014). Ethics in data journalism: accuracy. Online Journalism Blog. URL: https://onlinejournalismblog.com/2013/09/13/ethics-in-data-journalism-accuracy/
Brodie, M. L. (1980). Data quality in information systems. Information & Management, 3(6), 245-258.
Caswell, D., & Dörr, K. (2017). Automated Journalism 2.0: Event-driven narratives: From simple descriptions to real stories. Journalism Practice, 1-20.
Chapman, A. D. (2005). Principles of data quality. GBIF.
Chiang, F., & Miller, R. J. (2008). Discovering data quality rules. Proceedings of the VLDB Endowment, 1(1), 1166-1177.
Clerwall, C. (2014). Enter the robot journalist: Users’ perceptions of automated content. Journalism Practice, 8(5), 519-531.
Coddington, M. (2015). Clarifying journalism’s quantitative turn: A typology for evaluating data journalism, computational journalism, and computer-assisted reporting. Digital Journalism, 3(3), 331-348.
Diakopoulos, N. (2011). A functional roadmap for innovation in computational journalism. White paper.
Dörr, K. N., & Hollnbuchner, K. (2016). Ethical Challenges of Algorithmic Journalism. Digital Journalism, 5(4), 404-419.
Eckerson, W. W. (2002). Data quality and the bottom line: Achieving business success through a commitment to high quality data. The Data Warehousing Institute, 1-36.
Felstiner, W. L., Abel, R. L., & Sarat, A. (1980). The Emergence and Transformation of Disputes: Naming, Blaming, Claiming… Law and society review, 631-654.
Flew, T., Spurgeon, C., Daniel, A., & Swift, A. (2012). The promise of computational journalism. Journalism Practice, 6(2), 157-171.
Flichy, P., Parasie, S. (2013). Sociologie des bases de données. Sociologie, 2(3), 9-19.
Fox, C., Levitin, A., & Redman, T. (1994). The notion of data and its quality dimensions. Information processing & management, 30(1), 9-19.
Graefe, A. (2016). Guide to automated journalism. Tow Center for digital journalism.
Hainaut, J. L. (2012). Bases de données-2e éd. : Concepts, utilisation et développement. Dunod.
Hamilton, J. T., & Turner, F. (2009, July). Accountability through algorithm: Developing the field of computational journalism. In Report from the Center for Advanced Study in the Behavioral Sciences, Summer Workshop (pp. 27-41).
Haug, A., Stentoft Arlbjørn, J., & Pedersen, A. (2009). A classification model of ERP system
data quality. Industrial Management & Data Systems, 109(8), 1053-1068.
Howard, A. (2013). On the Ethics of Data-Driven Journalism: of fact, friction and public records in a more transparent age. Tow Center for digital journalism.
Howard, A. (2014). The Art and Science of Data-Driven Journalism. Tow Center for digital journalism.
Karlsen, J., & Stavelin, E. (2014). Computational journalism in Norwegian newsrooms. Journalism practice, 8(1), 34-48.
Kent, T. (2015). Ethical check-list for robot journalism. Medium. URL: https://medium.com/@tjrkent/an-ethical-checklist-for-robot-journalism-1f41dcbd7be2
Linden, C. G. (2017). Decades of Automation in the Newsroom: Why are there still so many jobs in journalism?. Digital Journalism, 5(2), 123-140.
Lecompte, Celeste. 2015. Automation in the Newsroom. Nieman Reports, 69 (3): 32–45.
Lewis, S. C., & Usher, N. (2013). Open source and journalism: Toward new frameworks for imagining news innovation. Media, culture & society, 35(5), 602-619.
Madnick, S., & Zhu, H. (2006). Improving data quality through effective use of data semantics. Data & Knowledge Engineering, 59(2), 460-475.
McCallum, Q. (2012). Bad data handbook. O’Reilly Media, Inc.
Moody, D. L., & Shanks, G. G. (2003). Improving the quality of data models: empirical validation of a quality management framework. Information systems, 28(6), 619-650.
Neveu, E. (1999). L’approche constructiviste des “problèmes publics”. Un aperçu des travaux anglo-saxons. Etudes de communication. Langages, information, médiations, (22), 41-58.
Neveu, E. (2015). Sociologie politique des problèmes publics. Armand Colin.
Parasie, S., & Dagiral, E. (2013). Data-driven journalism and the public good:“Computer- assisted-reporters” and “programmer-journalists” in Chicago. New media & society, 15(6), 853-871.
Pipino, L. L., Lee, Y. W., & Wang, R. Y. (2002). Data quality assessment. Communications of the ACM, 45(4), 211-218.
Redman, T. C. (2001). Data quality: the field guide. Digital press.
Reid, R., Fraser-King, G., & Schwaderer, W. D. (2007). Data lifecycles: managing data for strategic advantage. John Wiley & Sons.
Royal, C. (2010, April). The journalist as programmer: A case study of the New York Times interactive news technology department. In International Symposium on Online Journalism.
Scannapieco, M., Virgillito, A., Marchetti, C., Mecella, M., & Baldoni, R. (2004). The DaQuinCIS architecture: a platform for exchanging and improving data quality in cooperative information systems. Information systems, 29(7), 551-582.
Shanks, G. (1999, September). Semiotic approach to understanding representation in information systems. In Proceedings of the information systems foundations workshop, ontology, semiotics and practice.
Strong, D. M., Lee, Y. W., & Wang, R. Y. (1997). Data quality in context. Communications of the ACM, 40(5), 103-110.
Sundar, S. S. (1998). Effect of source attribution on perception of online news stories. Journalism & Mass Communication Quarterly, 75(1), 55-68.
Tejay, G., Dhillon, G., & Chin, A. G. (2005). Data quality dimensions for information systems security: A theoretical exposition. In Security management, integrity, and internal control in Information Systems (pp. 21-39). Springer, Boston, MA.
The Quartz guide to bad data (2016). GitHub. URL: https://github.com/Quartz/bad-data-guide
Tredan, O., & Dierickx, L. (2017, 10-12 July). L’Open data à Rennes ou en quoi l’Open Data ne change pas le gouvernement des villes. Paper presented at Les données et le gouvernement de la ville, Montpellier : Association Française de Science Politique.
Verborgh, R., & De Wilde, M. (2013). Using OpenRefine. Packt Publishing Ltd.
Wand, Y., & Wang, R. Y. (1996). Anchoring data quality dimensions in ontological foundations. Communications of the ACM, 39(11), 86-95.
Wang, R. Y., & Strong, D. M. (1996). Beyond accuracy: What data quality means to data consumers. Journal of management information systems, 12(4), 5-33.
Weidema, B. P., & Wesnaes, M. S. (1996). Data quality management for life cycle inventories—an example of using data quality indicators. Journal of cleaner production, 4(3-4), 167-174.
Zion, L., & Craig, D. (Eds.) (2014). Ethics for digital journalists: emerging best practices. Routledge.